
What Is The Gantt Chart In Project Management?
What Is The Gantt Chart In Project Management?
Table of Content
Origins of the Tool
Definition Of A Gantt Chart
Reasons to use the Gantt Charts
How to create a Gantt Chart Basic Procedure
Common mistakes to avoid when using a Gantt chart.
References
A Gantt chart is a popular project management tool for visually representing a project timetable. It enables project managers to track progress, anticipates potential delays, and efficiently allocate resources. In this guide, we’ll go over the fundamentals of Gantt charts and how they may help you with project management.
ORIGINS OF THE TOOL
In the late 1800s, Polish engineer Karol Adamiecki developed a visual workflow chart that he called a “her monogram.”
In around 1910, Henry Gantt, a management consultant, and the engineer took Adamiecki’s concept to the next stage. His chart was designed to help manufacturing supervisors see whether their work was on, ahead of, or behind schedule, and it formed the foundation of the tool we use today.
DEFINITION OF A GANTT CHART
A Gantt Chart is a step-by-step visual timeline of all the activities included in a project. Its two main components – a timeline table and a timeline bar chart – present the information both textually and graphically.
A Gantt Chart normally includes the project’s start and finish dates, as well as its terminal and summary tasks. Each step is shown graphically as a bar against a horizontal time scale (Gantt Chart History, Gantt Chart Software, and Gantt Chart Information, 2012).
Why Use Gantt Charts?
Because of the many advantages offered by Gantt charts, thousands of companies use Gantt charts to become more productive, enhance their communications, forecast over the long term, and track results. While some naysayers believe they limit the size of the project that can be tracked, those using Gantt charts note an array of key benefits, including the five listed here.
REASONS TO USE THE GANTT CHARTS
While there are several reasons to use Gantt charts below are five key reasons they are often advantageous:
Avoid Completion Confusion: Gantt charts were created to keep users on track, providing a visual timeline for starting and finishing specific tasks. By providing a visual overview of milestones and other key dates, these charts offer a more understandable and memorable method of maintaining timescale-based tasks and deliverables whether tracked on a daily, weekly, monthly or yearly basis.
Keep everyone on the Same Page: Where there is a visual framework for the work to be done, there are fewer chances for misunderstanding, especially when it comes to highly complex tasks. Using Gantt charts allow all types of stakeholders to have the same information, set mutually understood expectations, and conduct their efforts according to the desired protocol.
Understand Task Relationships: These charts can make clear how various tasks are interrelated and perhaps rely on the completion of another to meet specific objectives. These task relationships revolve around understanding the timing of each task, which then impacts other tasks listed. This can better assure the optimum workflow, maximized productivity and overall project success.
Effectively Allocate Resources: By being able to look ahead on the Gantt chart, users can discern where resources need to be anticipated, allocated or shared to maximize the use of those resources. The more closely the chart is followed, the better chance there is of keeping project costs within budget while also better assuring on-time completion.
Get a Handle on the Future: While it is often easy to get caught up in day-to-day tasks as detailed on a chart, Gantt chart advantages include helping decision-makers look farther ahead to ensure each given project is working toward the achievement of the organization’s long-term strategic objectives.
When you set up a Gantt chart, you need to think through all of the tasks involved in your project. As part of this process, you’ll work out who will be responsible for each task, how long each task will take, and what problems your team may encounter. This detailed thinking helps you ensure that the schedule is workable, that the right people are assigned to each task, and that you have workarounds for potential problems before you start.
They also help you work out practical aspects of a project, such as the minimum time it will take to deliver, and which tasks need to be completed before others can start. Plus, you can use them to identify the critical path – the sequence of tasks that must individually be completed on time if the whole project is to deliver on time.
Finally, you can use them to keep your team and your sponsors informed of progress. Simply update the chart to show schedule changes and their implications, or use it to communicate that key tasks have been completed.
Creating the Gantt Chart
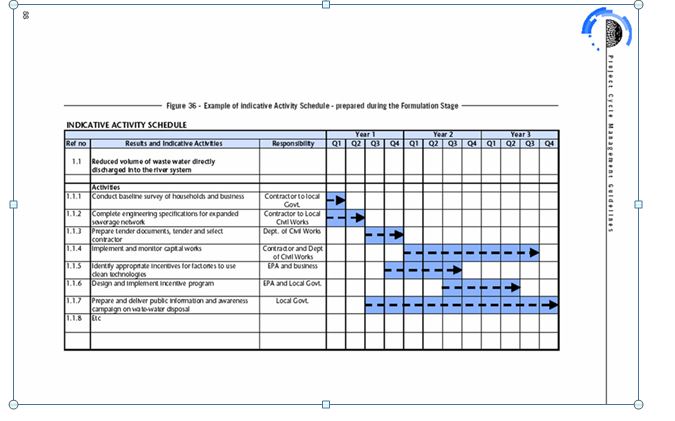
Gantt charts show all the key stages of a project and their duration as a bar chart, with the time scale across the top. The key stages are placed on the bar chart in sequence, starting in the top left corner and ending in the bottom right corner (Figure 1). A Gantt chart can be drawn quickly and easily and is often the first tool a project manager uses to provide a rough estimate of the time that it will take to complete the key tasks.
Sometimes it is useful to start with the target deadline for the completion of the whole project because it is soon apparent if the time scale is too short or unnecessarily long. The detailed Gantt chart is usually constructed after the main objectives have been determined. Below is an example of a Gantt chart.
GANTT CHART BASIC PROCEDURE
The basic procedure must be followed to build a Gantt chart.
1). Identify the steps or activities needed to complete the project.
2). Identify milestones within the project.
3). Identify the expected time required to complete each task.
4). Identify the sequence of tasks and the order of precedence of tasks.
5). Draw a horizontal time axis on the bottom of a page.
6). Select a proper time scale to represent the length of tasks.
7). Prepare a column on the left side of the paper; write down each activity and milestone of the project in their corresponding order of occurrence.
8). Activities or milestones that occur at a specific point in time represent them using a diamond under the time the activity must happen.
9). Activities that occur over a determined period draw horizontal bars, or an empty rectangle starting from the first day the activity will take place and finishing the day the activity ends. Do not fill inside the rectangle.
10). Each activity or task must be listed in the Gantt chart.
11). Fill up the diamond or the rectangle as each activity is being performed.
12). Use a weight or plumb as a vertical marker to illustrate the actual time and progress of the project.
Gantt Chart Considerations
Gantt charts are also modified with additional columns showing details such as the amount of time estimated to perform each task, how many resources are needed to complete each activity and/or the person responsible to execute the activity.
Specific meetings or reviewing processes are not recommended to be listed on a Gantt chart because they might occur over a long period. Gantt chart will transmit a clear idea to construction professionals about what must be done to complete a specific task and can promote a healthy scheduling process.
You can see an example in Figure 1, below:
COMMON MISTAKES TO AVOID WHEN USING A GANTT CHART.
While Gantt charts can be extremely valuable tools for project management, there are certain typical flaws that can impair their usefulness. One error is forgetting to update the chart on a regular basis, which can result in erroneous information and missed deadlines.
Another common error is failing to include all essential activities and dependencies, which can lead to incomplete or unrealistic timelines. Overcomplicating the chart with too much detail might also make it difficult to read and understand.
By avoiding these typical blunders, you can ensure that your Gantt chart is a useful tool for project management.
Also read: How can we assess the needs of the community
REFERENCES
Gantt Chart – Gantt Chart History, Gantt Chart Software, and Gantt Chart Information, Retrieved from http://www.ganttchart.com/index.html
Gantt Chart – Wikipedia, Retrieved from http://en.wikipedia.org/wiki/Gantt_chart
Doran, George T. “There’s a S.M.A.R.T. way to write management’s goals and objectives.” Management Review 70.11 (Nov. 1981): 35. Business Source Corporate. EBSCO. 15 Oct. 2008.
GOAL SETTING AND SELF-CONTROL. By: RAIA, ANTHONY P.. Journal of Management Studies, Feb 1965, Vol. 2 Issue 1, p34-53, 20p; EBSCO. 31 Oct. 2008


Leave a Reply